You might have that terrible feeling when buying a new car. After picking it up and driving your new car out of the show room, it immediately looses value! The question is: how much? Of course this car depreciation will depend on the make and model of the car.
In order to get some idea of the depreciation I have extracted data from a Dutch used car sales site www.autotrader.nl, so the amounts are in Euros.There are some features that you can scrape for every car like. For example the make, brand, fuel type, transmission, energy label, age. To get an idea of the data, the figure below displays around 2000 Renault Clios, extracted from the site. On the x axis, we have mileage (in this case kilometers driven), and on the y axis we have the price in Euros (the price that is displayed in the add, so not the price that is actually paid).
A simple linear regression model is fitted with these 2000 Renault Clio’s. The parameters are given in the following figure
So on average, a new Clio will cost around 15,082 Euros (Clios with automatic transmission are 1989 Euros more expensive), every kilometer you drive in a Clio will cost you 7.28 cents in loss of value, The R-squared of this simple regression model is 0.66. Some other cars to compare the depreciation are given in the table below.
Looking at the plot above, you can already see that a straight line is probably not the best curve that can fit the data points. Hmmm, so what other curves can we try? Splines!
Splines can be seen as piece-wise polynomials, glued together. So for example from 0 to 25,000 kilometers a polynomial is used to predict the price, from 25,000 km to 75,000 another polynomial is used to predict the price. The points at which the polynomials are glued together are called knots. Splines are constructed in such a way that at the knots we have a smooth curve. The term comes from the tool used by shipbuilders and drafters to construct smooth shapes having desired properties. Drafters have long made use of a bendable strip fixed in position at a number of points that relaxes to form a smooth curve passing through those points.
In SAS the adaptivereg procedure can fit splines. It has some handy features, it constructs spline basis functions in an adaptive way by automatically selecting appropriate knot values for different variables and obtains reduced models by applying model selection techniques. Let’s fit a spline model on the Renault Clio’s using the procedure.
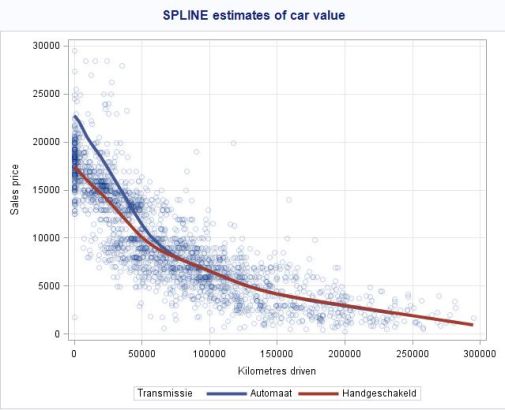
The spline model has an R-squared of 0.76, a big improvement compared to the R-squared of 0.66 of the simple linear regression model. How does the car value prediction look like? Look at the figure below
we see that new Clios with an automatic transmission are around 5000 Euro more expensive than Clios with a manual transmission, however, these automatics loose value much faster. There is a turning point at around 55,000 KM, the rate at which a Clio looses value (around 17 cents/KM) starts to decline after 55,000 KM (around 4 cents/KM). Interested in the depreciation of other car makes, look at my little Shiny app.
Cheers,
A happy Clio driver!


Pingback: Deploying a car price model using R and AzureML | Longhow Lam's Blog
could you share the code for the scraper? I am trying to learn how to build these. what tools do you recommend? thank you, Peter
LikeLike
Peter,
I have used the R package rvest to scrape data from web sites. Example code can be found on my blog post on soap analytics. And there are many good tutorials out there,
Cheers,
Longhow
LikeLike
I got this already from the post, was hoping for a full code example with this data… I’m a rookie with R etc. thanks anyhow for responding.
LikeLike
Hi Peter, send me an e-mail to remember me to send you the R script. longhowlam at g m a il dot com.
Cheers,
Longhow
LikeLike
Hey, just wanted to thank you for your work. Well done !
It would have been nice to have the spline formula displayed in the app too, maybe in a future version ? 🙂
LikeLike
Great stuff Longhow, I’m trying to recreate something very similar in python and this was super useful. Thanks for taking the time!
LikeLike
$3k/yr – BWM 5 2019 – lol
LikeLike