
I have decided to continue on Linkedin to share my thoughts on data science, tips and tricks and opinions. No new content here on WordPress anymore.
Search the Bold

Looking for specific episodes of The Bold and The Beautiful?
There is a nice python package “holmes-extractor” that builds upon the spacy package. It supports a couple of use cases.
- Chatbot
- Structural matching
- Topic matching
- Supervised document classification I
I have used 4000 recaps of The Bold and the beautiful of the last 16 years to test Topic matching. I am using it to find texts in the recaps whose meaning is close to that of another query document or a query phrase entered by the user.
Just one example: Looking for: “she wanted to be close to him” gave me the recap of 2013-12-09: “It had only just begun, and he wanted to be closer to her. He had wanted to touch her, grab her, and he knew she wanted the same thing.“
The code of holmes is concise, runs out of the box with little tweaking and tuning. See the Python module here. Try it out yourself and find your favourite TBATB episode. My example notebook and recaps.
Semi Visual deep learning in Dataiku
1. Introduction
With the availability of GPU’s on demand in the cloud for a very decent price, and deep learning frameworks getting more and more mature, it is now more than ever easier to experiment with deep learning and create models.
There might be a downside to this, if you don’t manage your experiments and analyses carefully, you could end up with lots of code or notebooks of all your analyses. Dataiku provides a nice environment where you are guided through your deep learning experiments. The software will help your experiments to be organized, managed and shareable. Moreover, their “semi visual deep learning” approach, as they call it, provides the following benefits:
- Preprocessing your data (Handling missing values, categorical data, rescaling, …)
- Handling the training process, including epochs, generators, early stopping
- Showing per-epoch training charts and giving early stopping capabilities
- Integrating with Tensorboard, Building all results metrics and charts
- Giving ability to score, Deploying deep learning models to API nodes for production deployments
In short, with Dataiku you can re-use code an models as much as possible so that you as a data scientist can focus on the analysis or experiment.
Hardware and software
There is a free edition of Dataiku that contains the semi visual deep learning. It is easy to install it, you’ll find more info here. To speed up deep learning computations I installed Dataiku on a deep learning VM with a GPU on the Google Cloud platform. This is handy, all the drivers and third party dependencies are installed and pre-configured for you.
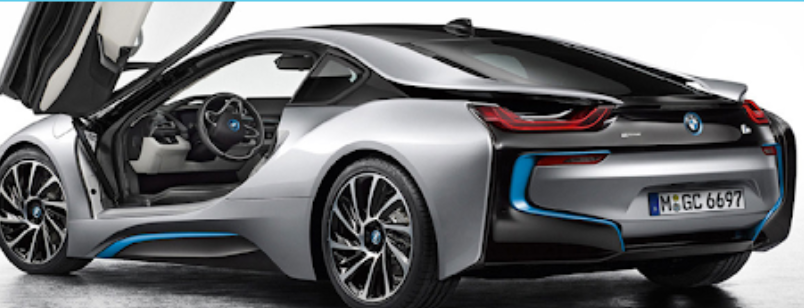
2. BMW and Peugeot’s
The data I have used for this little exercise are 350 images of cars. Specifically, I have images of BMW’s and Peugeot’s divided evenly. It is not a big collection of images. The question is, can we build a car classifier on this data set?
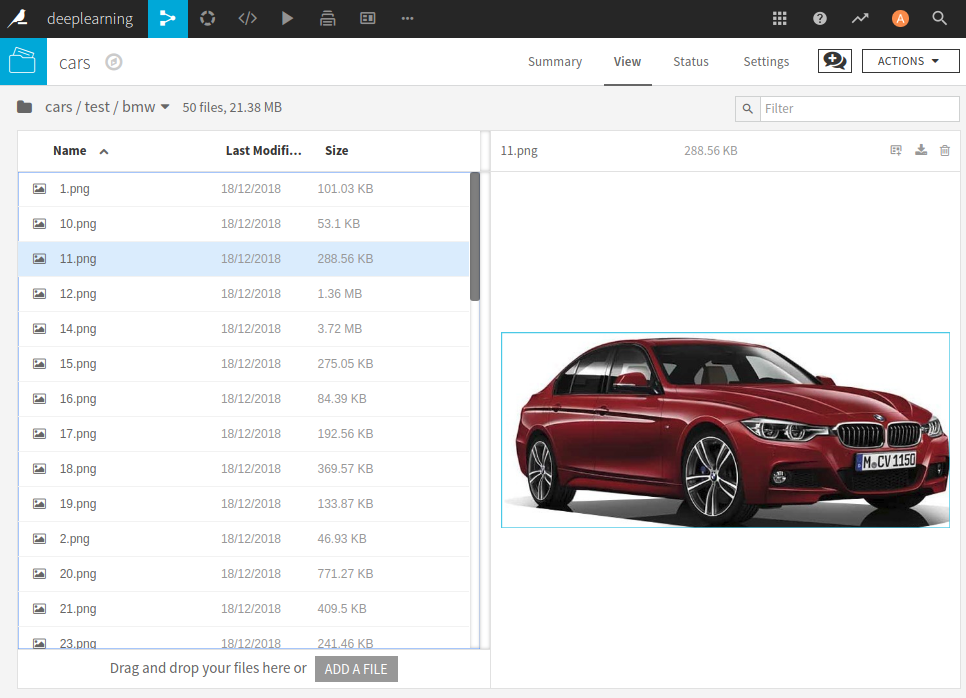
We start with an empty project in Dataiku, from this project you can define a folder to upload the images that you need. There should be a train and test sub folder and in those folders you need sub folders for each class. So a BMW and Peugeot sub folder in my case.
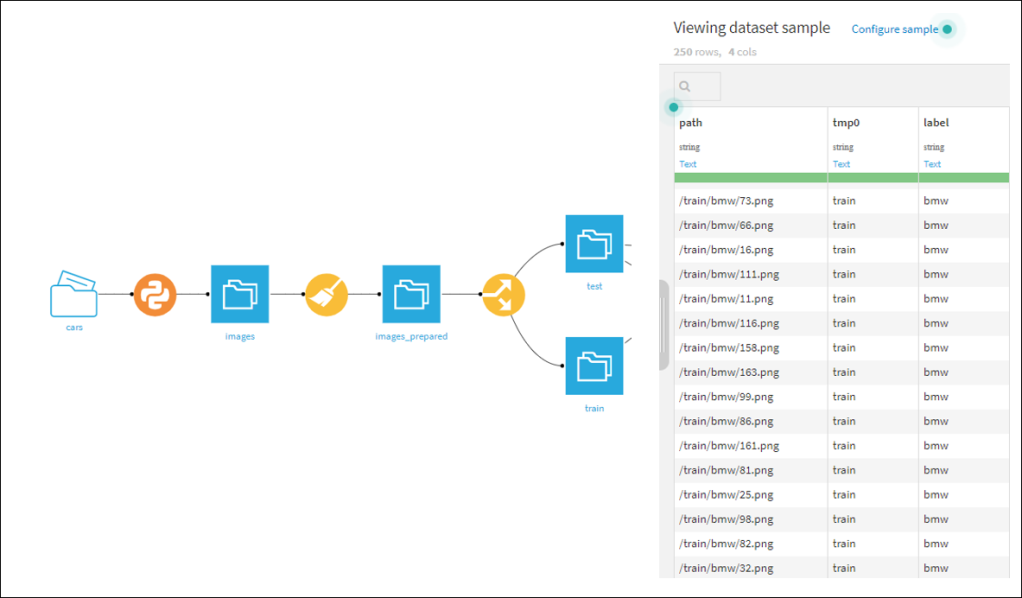
From this folder a few steps are needed to create a test and train data set. In these sets we have the path and label of each image in the folder.
3. Some deep learning experiments
We now have the data set in a suitable format and the underlying images in a Dataiku folder. There are several approaches you could under take in building a car classifier. I tried the following
- Build small CNN’s from scratch,
- Use pre trained networks for transfer learning.
We start an analysis by selecting the ‘Lab’ environment and then specify the type of analysis,
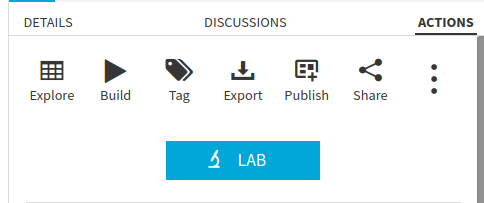
in my case a prediction task where you need to specify the label column and the ‘Deep Learning’ mode.
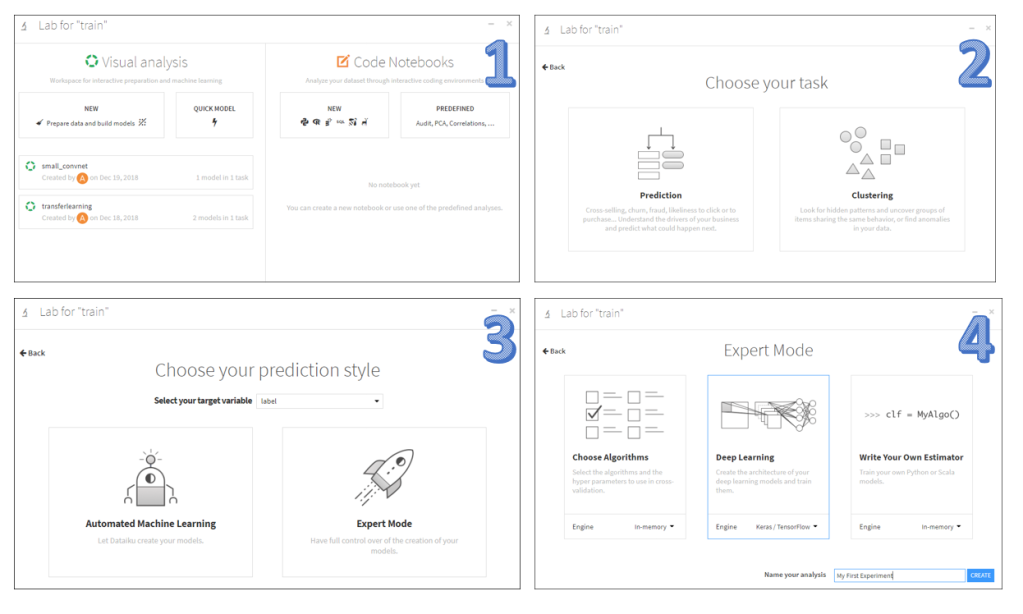
Dataiku will launch a ‘Design’ interface of the analysis where you can set different options: the metrics to use, shuffling, batch sizes, number of epochs. The most import setting is the architecture of the network. The deep learning frame work is based on keras / tensorflow. So the thing you need to do as an end user is to specify the neural network layers with ‘keras syntax in a Python function. By default a simple model is already inserted: a one dense layer network architecture.
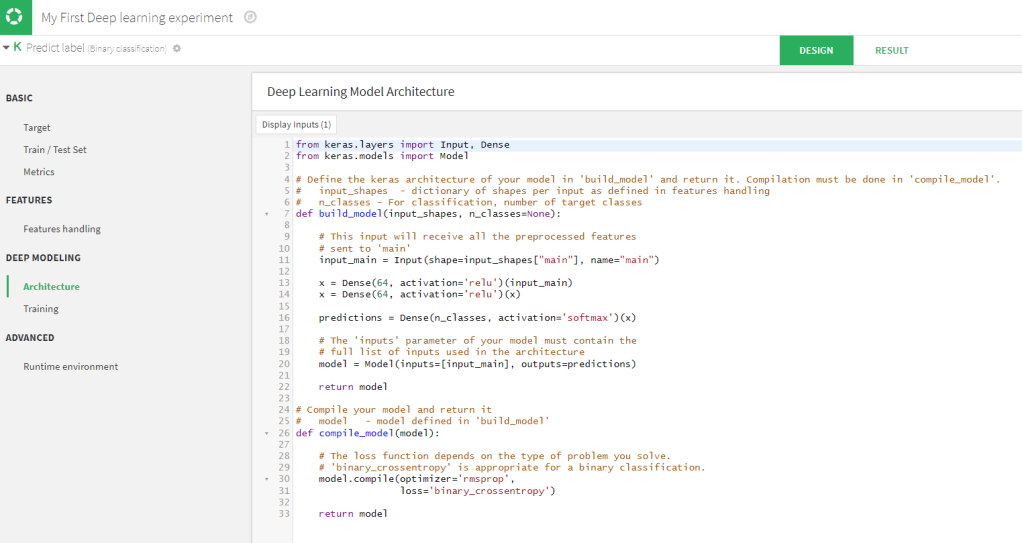
This model will be too simple for image classifications, fortunately there are some other prebuild network architectures that you can re-use. Moreover, you can add your own architectures to the list, so that it will become easy to use those. as well.
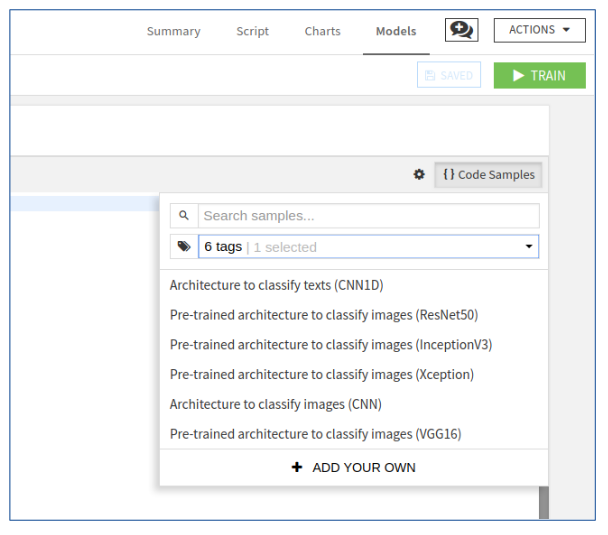
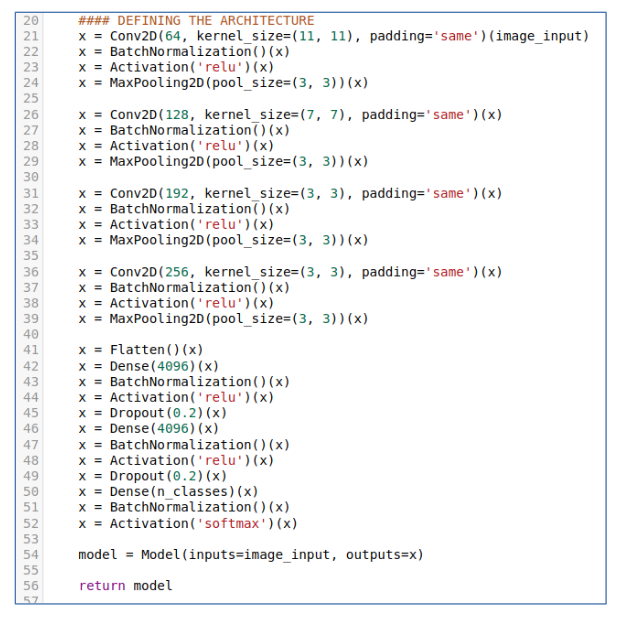
We can for example select ‘Architecture to classify images (CNN)’ that is already there, then we get the following code:
If you are happy with the model and the rest of the settings you can start training. Since I installed Dataiku on a machine with a GPU, it can make use of it.
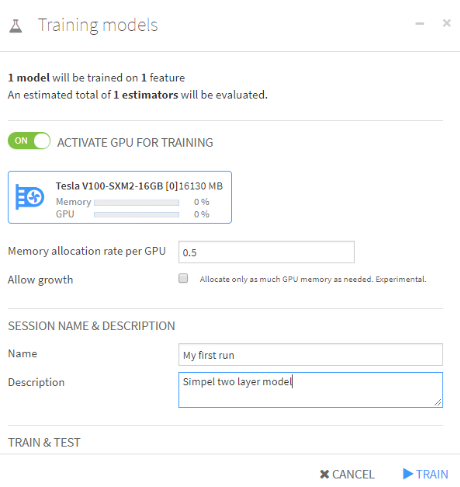
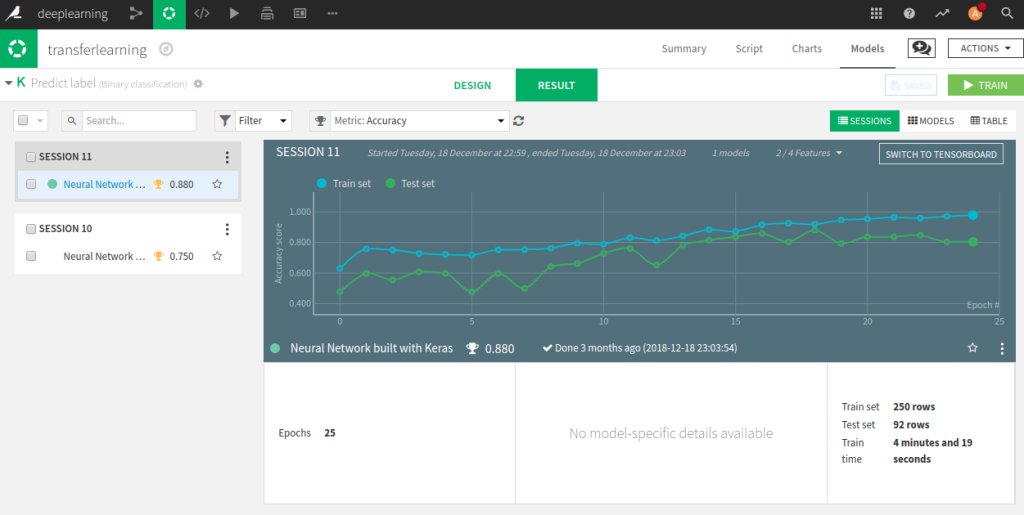
You can give a name to this specific session, that might be handy when you have different runs. Even with a GPU, it can take some time to finish. During the training Dataiku will keep track of the training metrics on each epoch in a graph, as the graph below show. The whole process runs on the background, so you can do other things in the system, like setting up another deep learning analysis if you want to.
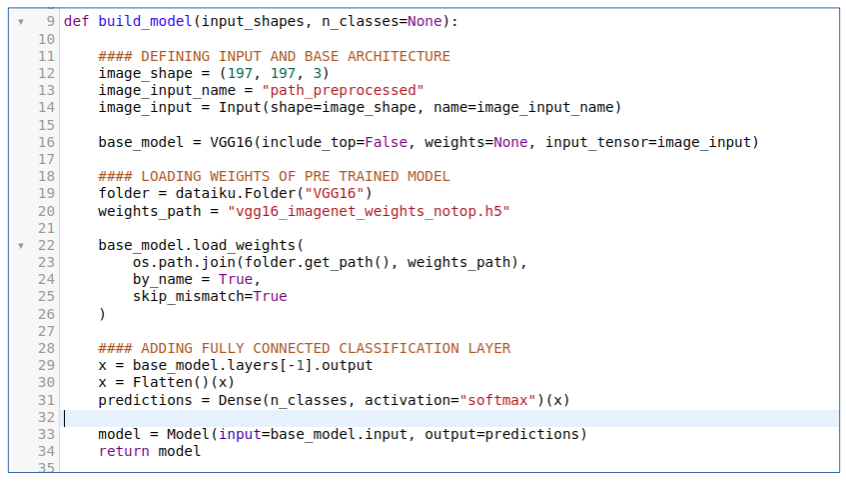
Another experiment we can setup is building an image classifier by using transfer learning. In the code samples we can select ‘pre trained architecture to classify images’. Then the following code, as displayed in the figure below, will appear. It is much shorter it loads the pre-trained VGG16 network with out the top layer, we will replace that by a fully connected layer.
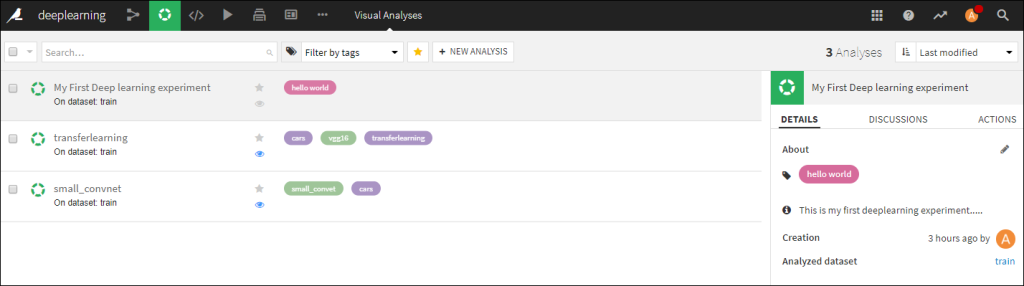
It is not that difficult to setup more and more experiments/analyses with different network architectures. To manage all those experiments Dataiku provides an interface where you can tag and name your different analysis and give them short descriptions. The results of all your analysis are stored as well, i.e. training settings, training metrics and tensor boards. The figure below shows three analysis that I have created.
4. Conclusion
With so little images a small convolutional network trained from scratch is not working well here, using transfer learning with a pre-trained model works reasonably well. Semi visual deep learning in Dataiku provides a nice environment to create, manage, share and keep track of many deep learning experiments. That’s it for now, stay tuned for more Dataiku news from me. Cheers, Longhow
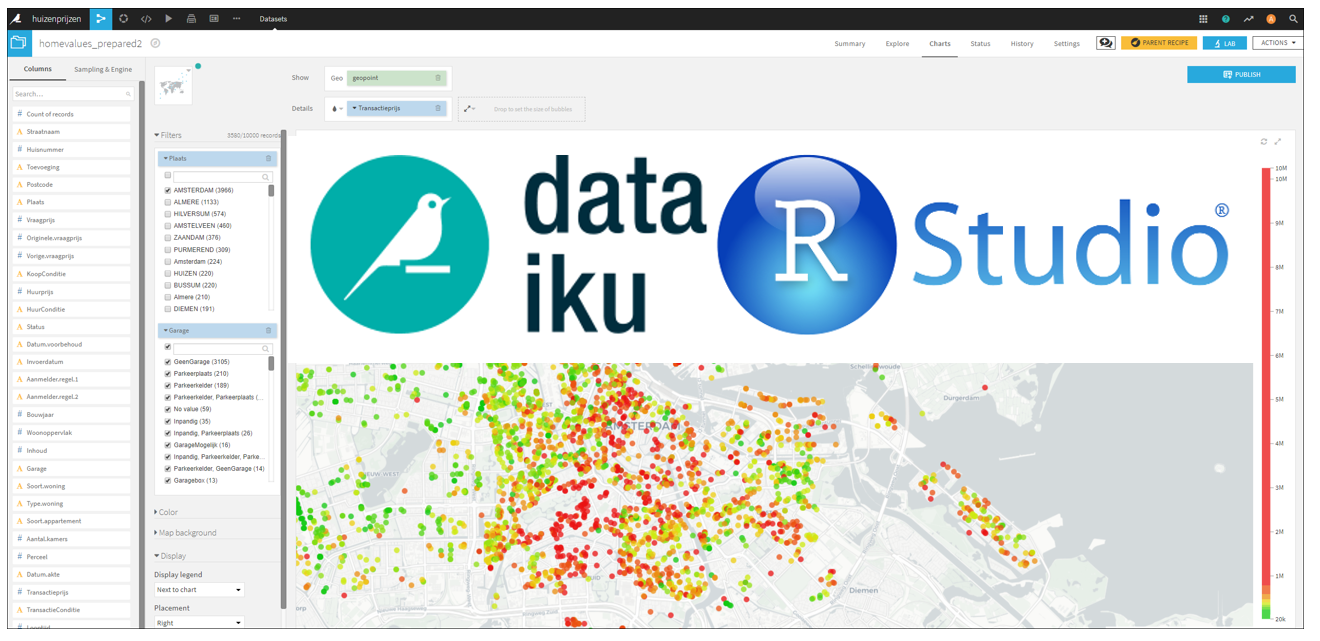
Dataiku with RStudio integration
Introduction
Some time ago I wrote about the support for R users within Dataiku. The software can really boost the productivity of R users by having:
- Managed R code environments,
- Support for publishing of R markdown files and shiny apps in Dataiku dashboards,
- The ability to easily create and deploy API’s based on R functions.
See the blog post here.
With the 5.1 release of Dataiku two of my favorite data science tools are brought closely together :-). Within Dataiku there is now a nice integration with RStudio. And besides this, there is much more new functionality in the system, see the 5.1 release notes.
RStudio integration
From time to time, the visual recipes to perform certain tasks in Dataiku are not enough for what you want to do. In that case you can make use of code recipes. Different languages are supported, Python, Scala, SQL, shell and R. To edit the R code you are provided with an editor in Dataiku, it is however, not the best editor I’ve seen. Especially when you are used to the RStudio IDE 🙂
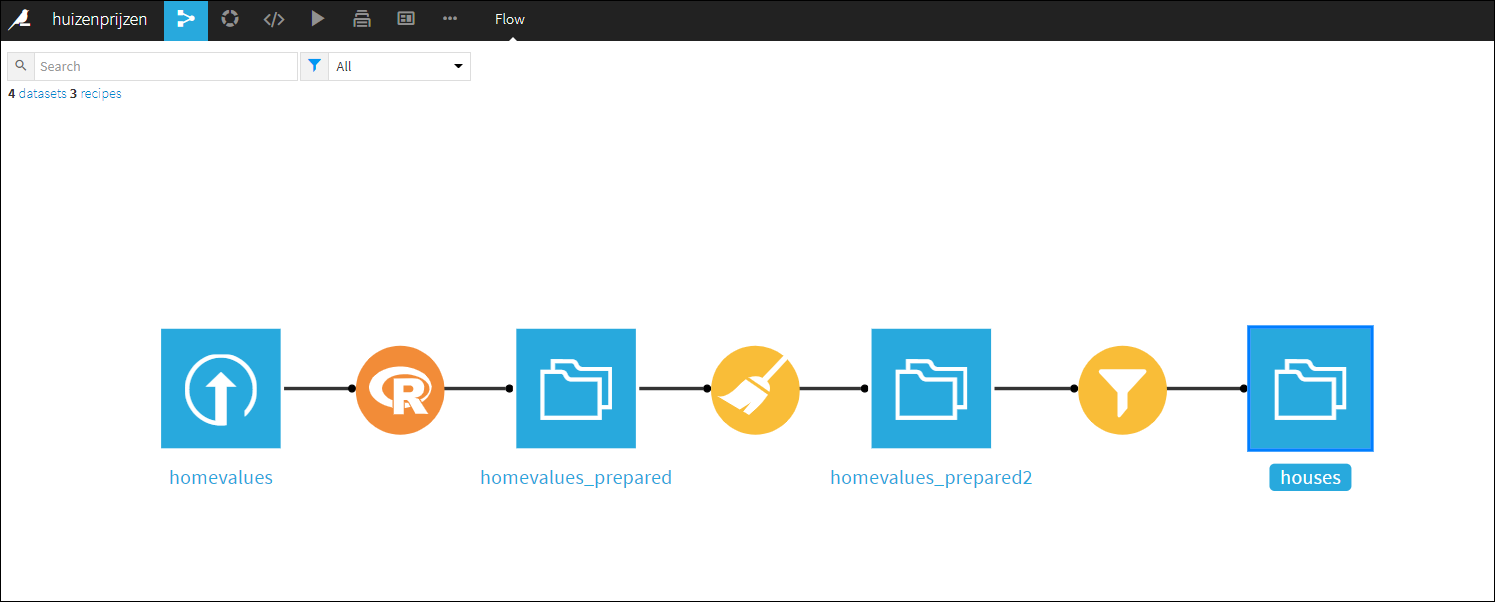
There is no need to create a new R editor, that would be a waist of time and resources. In Dataiku you can now easily use the RStudio environment in your Dataiku workflow.

Suppose you are using an R code recipe in your workflow, then in the code menu in Dataiku you can select ‘RStudio server’. It will bring you to an RStudio session (embedded) in the Dataiku interface (either on the same Dataiku server or on a different server).
In your (embedded) RStudio session you can easily ‘communicate’ with the Dataiku environment. There is a ‘dataiku’ R package that exposes functions and RStudio add-ins to make it easy to communicate with Dataiku. You can use it to bring over R code recipes and / or data from Dataiku. This will allow you to edit and test the R code recipe in RStudio with all the features that a modern IDE should have.

Once you are done editing and testing in RStudio you can then upload the R code recipe back to the Dataiku workflow. If your happy with the complete Dataiku workflow, put it into production, i.e. run it in database, or deploy it as an API. See this short video for a demo.
Stay tuned for more Dataiku and R updates….. Cheers, Longhow.
Are you leaking h2o? Call plumber!

Create a predictive model with the h2o package.
H2o is a fantastic open source machine learning platform with many different algorithms. There is Graphical user interface, a Python interface and an R interface. Suppose you want to create a predictive model, and you are lazy then just run automl.
Lets say, we have both train and test data sets, and the first column is the target and the columns 2 until 50 are input features. Then we can use the following code in R
out = h2o.automl(
   x = 2:50,
   y = 1,
   training_frame = TrainData,
   validation_frame = TestData,
   max_runtime_secs = 1800
)
According the help documentation: The current version of automl trains and cross-validates a Random Forest, an Extremely-Randomized Forest, a random grid of Gradient Boosting Machines (GBMs), a random grid of Deep Neural Nets, and then trains a Stacked Ensemble using all of the models.
After a time period that you can set, automl will terminate and has literally tried hundreds of models. You can get the top models, ranked by a certain performance metric. If you go for the champion just use:
championModel = out@leaderchampionModel
Now the championModel object can be used to score / predict new data with the simple call:
predict(championModel, newdata)
The champion model now lives on my laptop, it’s hard if not impossible to use this model in production. Someone or some process that wants a model score should not depend on you and your laptop!
Instead, the model should be available on a server where model prediction requests can be handled 24/7. This is where plumber comes in handy. First save the champion model to disk so that we can use it later.
h2o.saveModel(championModel, path = "myChampionmodel")
The plumber package, bring your model in production.
In a very simple and concise way, the plumber package allows users to expose existing R code as an API service available to others on the web or intranet. Now suppose you have a saved h2o model with three input features, how can we create an API from it? You decorate your R scoring code with special comments, as shown in the example code below.
# This is a Plumber API. In RStudio 1.2 or newer you can run the API by
# clicking the 'Run API' button above.

library(plumber)library(h2o)
h2o.init()
mymodel = h2o.loadModel("mySavedModel")

#* @apiTitle My model API engine

#### expose my model #################################
#* Return the prediction given three input features
#* @param input1 description for inp1
#* @param input2 description for inp2
#* @param input3 description for inp3
#* @post /mypredictivemodel
function( input1, input2, input3){
   scoredata = as.h2o(
      data.frame(input1, input2, input3 )
   )
   as.data.frame(predict(mymodel, scoredata))
}
To create and start the API service, you have to put the above code in a file and call the following code in R.
rapi <- plumber::plumb("plumber.R")  # Where 'plumber.R' is the location of the code file shown above
rapi$run(port=8000)
The output you see looks like:
Starting server to listen on port 8000
Running the swagger UI at http://127.0.0.1:8000/__swagger__/
And if you go to the swagger UI you can test the API in a web interface where you can enter values for the three input parameters.
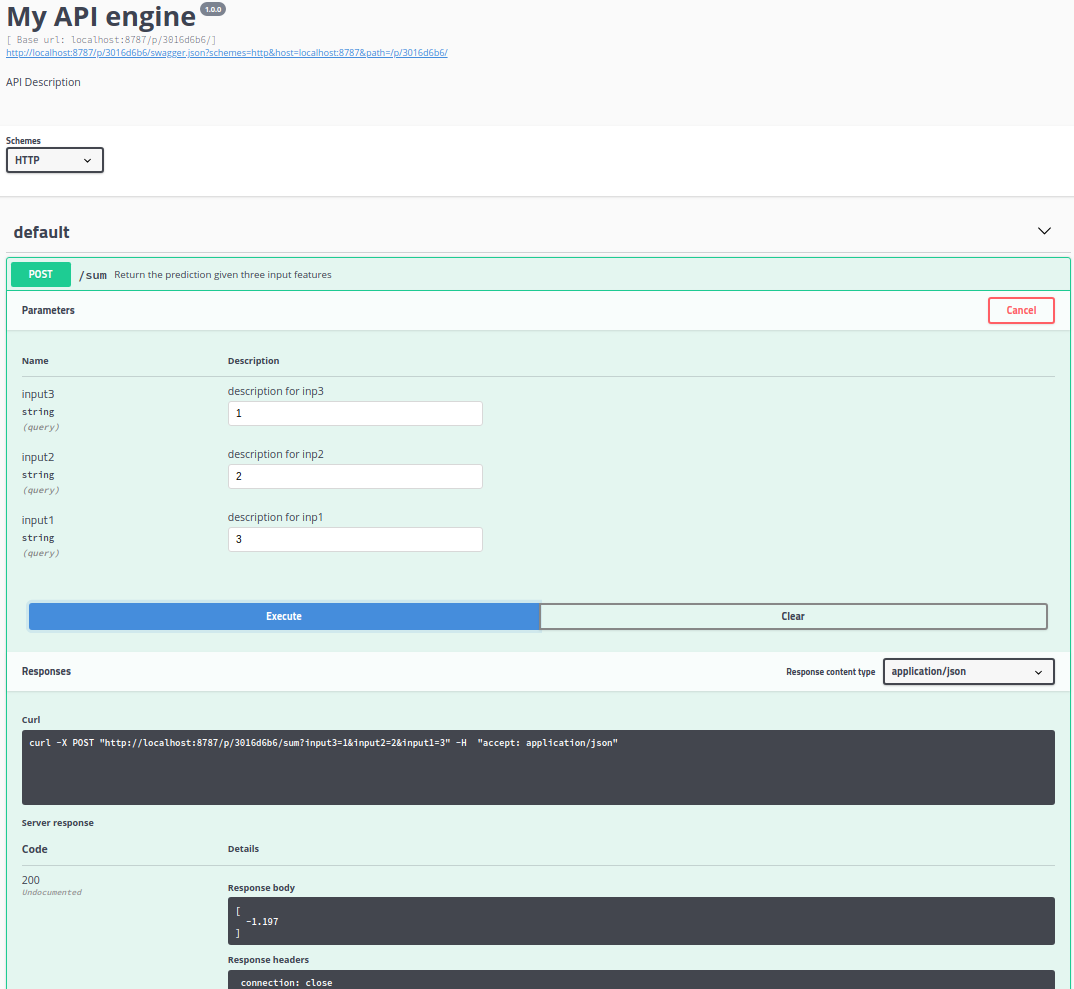
What about Performance?
At first glance I thought there might be quit some overhead, calling the h2o library, loading the h2o predictive model and then using the h2o predict function to calculate a prediction given the input features.
But I think it is workable. I installed R, h2o and plumber on a small n1-standard-2 Linux server on the Google Cloud Platform. One API call via plumber to calculate a prediction with a h2o random forest model with 100 trees took around 0.3 seconds to finish.
There is much more that plumber has to offer, see the full documentation.
Cheers, Longhow.
Selecting ‘special’ photos on your phone
At the beginning of the new year I always want to clean up my photos on my phone. It just never happens.
So now (like so many others I think) I have a lot of photos on my phone from the last 3.5 years. The iPhone photos app helps you a bit to go through your photos. But which ones are really special and you definitely want to keep?
Well, just apply some machine learning.
- I run all my photos through a VGG16 deep learning model to generate high dimensional features per photo (on my laptop without GPU this takes about 15 minutes for 2000 photos).
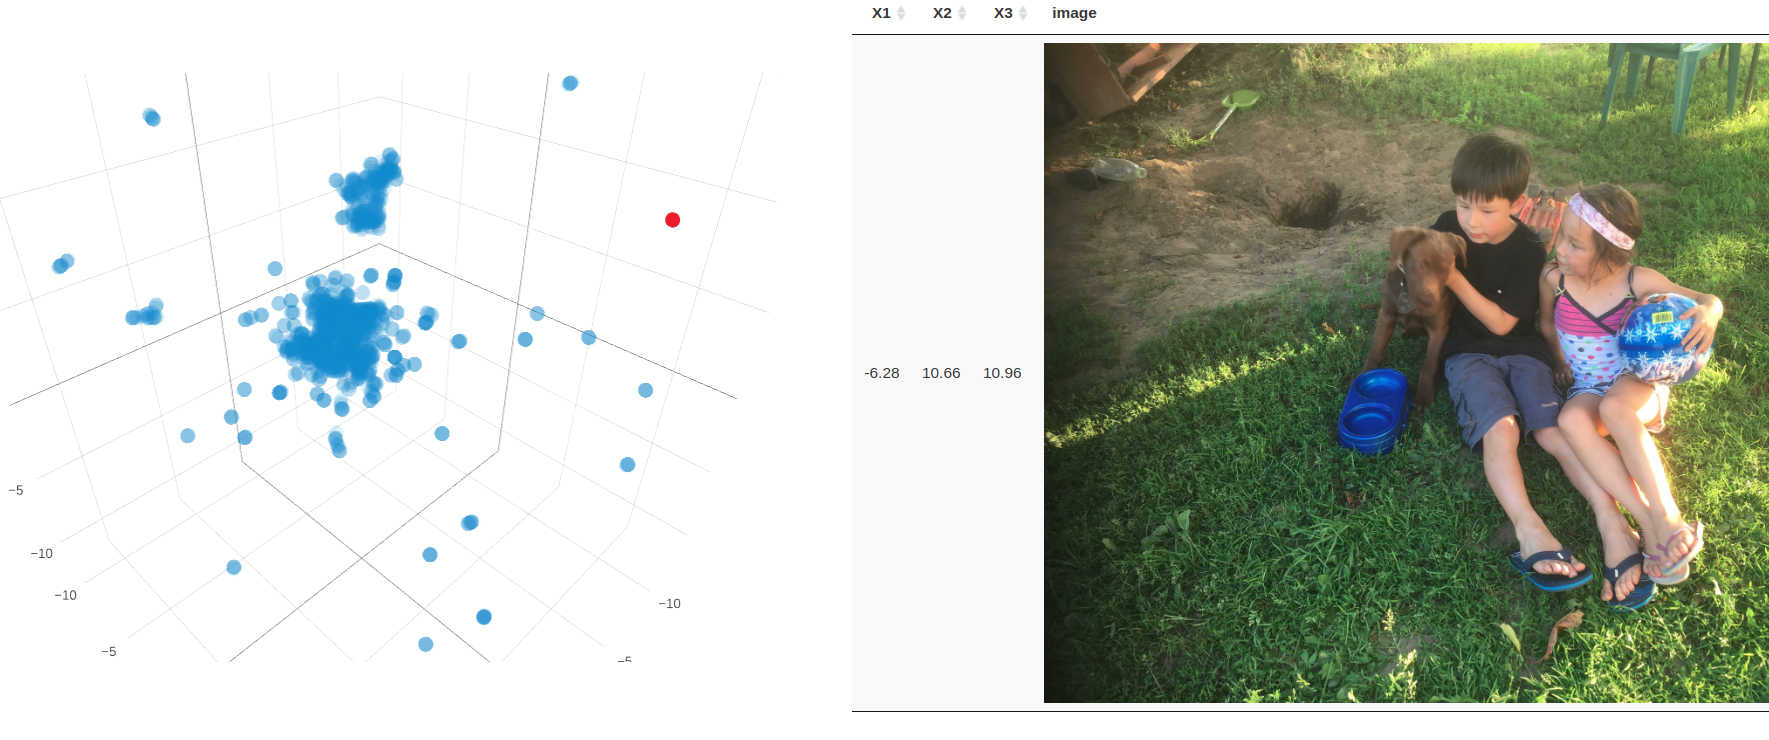
- The dimension is 25.088, which is difficult to visualize. I apply a UMAP dimension reduction to bring it back to 3.
- In R you can create an interactive 3D plot with plotly where each point corresponds to a photo. Using crosstalk, you can link it to the corresponding image. The photo appears when you hover over the point.
Well a “special” outlying picture in the scatter plot are my two children with a dog during a holiday a few years ago. I had never found it that fast. There are some other notable things that I can see, but I won’t bother you with it here 🙂
Link GitHub repo with to two R scripts to cluster your own photos. Cheers, Longhow
An R Shiny app to recognize flower species
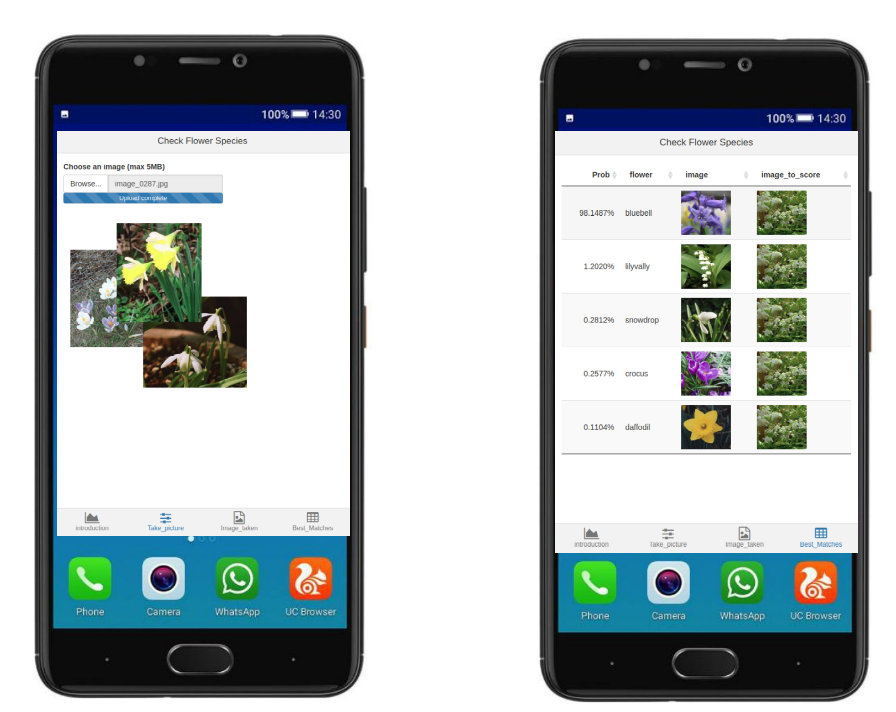
Introduction
Playing around with PyTorch and R Shiny resulted in a simple Shiny app where the user can upload a flower image, the system will then predict the flower species.
Steps that I took
- Download labeled flower data from the Visual Geometry Group,
- Install Pytorch and download their transfer learning tutorial script,
- You need to slightly adjust the script to work on the flower data,
- Train and Save the model as a (*.pt) file,
- Using the R reticulate package you can call python code from within R so that you can use a pytorch models in R,
- Create a Shiny app that allows the user to upload an image and display the predicted flower species.
Some links
Github repo with: Python notebook to fine tune the resnet18 model, R script with Shiny App, data folder with images.
Live running shiny app can be found here.
Cheers, Longhow
XSV tool
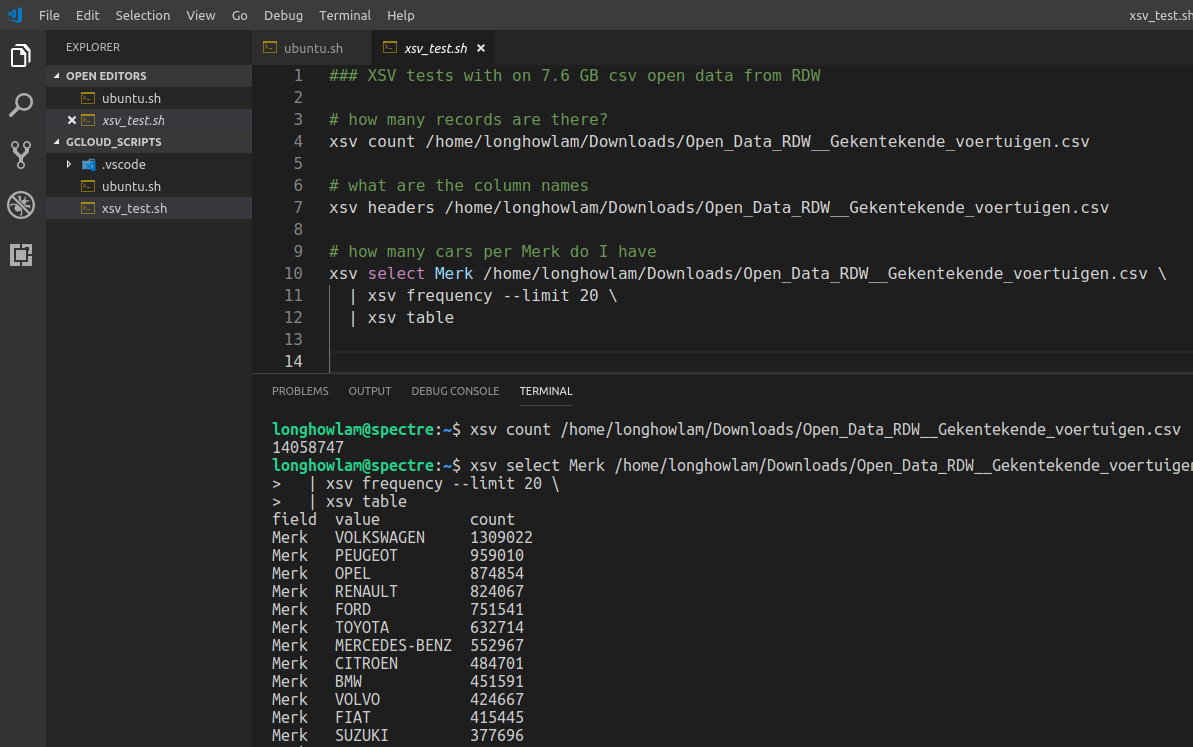
From time to time you do get large csv files. Take for example the open data from RDW with all the vehicles in The Netherlands. The size is ~ 7.6 GB (14 mln. rows and 64 columns), its not even really that large, but large enough for notepad, wordpad and Excel to hang….
There is a nice and handy tool XSV, see the github repo.
You can use it for some quick stats of the csv file and even some basic manipulations. For my csv file, It takes around 17 secs to count the number of records, around 18 secs to aggregate on a column.
In R data.table it took 2 minutes to import the set and in Python pandas 2.5 minutes
#CommandlineToolsAreStillCool #XSV #CSV
A pretty useless raspberry Pi application
What if you are not good in remembering faces? Well Buy a Rpi, camera and LED matrix display. Install openCV and the face-recognition library, and set it up with important faces to be recognized.
Point your camera to people and if there is a hit the LED display will show the name.
SatRday talks recordings

A couple of weeks ago, the first of September we had satRday in Amsterdam (The Netherlands) a fantastic event hosted by GoDataDriven. Now the great talks, including my 10 minute lightning talk on text2vec are online.
Cheers, Longhow
